Added Line Graphs to Changing Values
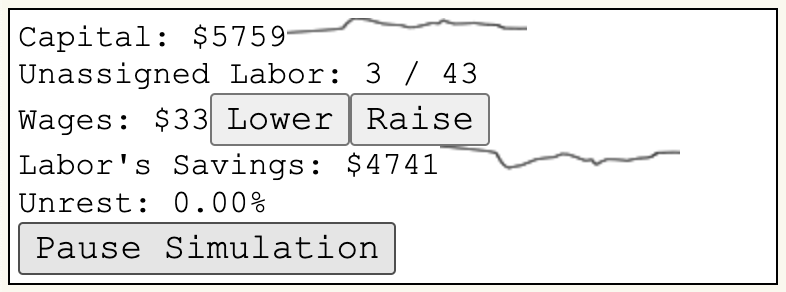
Due to popular demand (no pun intended), I've added line graphs to values in the game that change over time. This way you can see at a glance how values are changing. The values with graphs are:
- Capital
- Labor Savings
- Unrest
- Inventory for each commodity
- Demand for each commodity
I hope this helps make the game a better experience!
Leave a comment
Log in with itch.io to leave a comment.